There are two efficiencies being considered in the fans. Note that the fan efficiencies rated on fan data sheet may be reduced due to poor balance of blade, high tip clearance, incorrect tract of each blade, dirty surface of blade, obstructions to air flow, plenum geometry and other factors which were described in Chapter 2. Also the effect of fan speed at the constant pitch on cooling tower and the thermal performance depends previously on the effect of fan efficiency.

                    S.P. act. (inch Aq.) x Airflow(ft3/min)
Static Effi. = ----------------------------------------------------------
                               6356 x HP act. (HP)

                     T.P. act. (inch Aq.) x Airflow(ft3/min)
Total Effi. = ---------------------------------------------------------
                               6356 x HP act. (HP)

Where, HP act. = Actual break horsepower obtained from performance curve.
S.P. Act. = Actual static pressure @ given air density
T.P. Act. = Actual total pressure @ given air density
6356 = Unit Conversion Correction Coefficient
(1" Aq. = 5.2 lb/ft2, 1 HP = 33000 lb-ft/min. Acc'ly, 5.2 press. (in Aq.) / [33000 x HP act. (HP)] = 1/6356)

The Hudson fan performance curves are the result of tests run in accordance with Fig. 13 of Standard 210-74 "Laboratory Methods of Testing Fans for Rating" adopted by AMCA (Air Moving and Conditioning Association, Inc.) The test conditions to obtain performance curves is attached hereafter. Actual fan efficiencies will be different from the test conditions unless the actual environment is equivalent to the test conditions. There are some factors to rob the fan system of efficiency. The methods how to improve them shall be suggested here.

1) Fan System Efficiency

When we design an air moving device one of the most important tools we use is the fan performance curve. Using this curve of fan performance we plot a system resistance line to establish an operating point at which the fan performance exactly matches the system requirements. From the operating point we can define the fan pitch and power requirements. With almost any fans the pitch can be changed from the original estimate, if airflow is too low, to a higher pitch and greater flow. However, if the system efficiency or losses are not as assumed, more air, horsepower increases by the cube of the flow is needed. A ten percent increase in flow requires a thirty-three [HP2 = (Q2 / Q1)3 x HP1 = 1.13 HP1 = 1.331 x HP1, so 33.1% increase to HP1) percent increase in horsepower.

Fan performance curves generally are obtained under ideal, reproducible conditions. The Engineering Test Lab at Texas A&M's Research and Extension Center is the only independent test laboratory in U.S.A. with an AMCA certified wind tunnel. The lab tests everything from kitchen ventilators to scale model 60 feet diameter fans. The test conditions for high performance axial fans usually require blade tip clearance on a five foot model of about 0.04 of an inch with a large inlet bell conditions as ideal as possible. As a result of good aerodynamic design and minimized losses, total efficiencies are generally in the 75 to 85% range.

However, from experience with many full scale fan tests it is rare that "real life" performance exceeds 55 to 75% total efficiency. The difference is in "Fan System Efficiency". Although the fan efficiency is exactly same, the system efficiency is greatly different. Sometimes we find its capability is sadly insufficient, requiring expensive field modifications. What most likely caused the problem? Generally, tip losses, reverse flow at the fan hub and recirculation loss as below figure.

To refresh your memory as to terminology, the head or total pressure that an axial fan works against is made up of two components. These are static pressure which is the sum of the system resistance and velocity pressure which is a loss associated with accelerating the surrounding air from zero to the design velocity. The only useful work done is by the static pressure component. That is measured in inches of water and an axial fan normally works in the range of 0 to 2 inches total pressure.

2) System Losses

The holes in the Bucket. Potential losses in system efficiency occurs in several areas:

(A) Losses caused by the fixed system design rather than by variable physical properties. Once the operating point of the fan is fixed these losses are built-in and cannot be easily detected or corrected. They are losses because they rob the system of potential efficiency. Examples of this type of system "loss" would be: choice of fan design, fan diameter selection, fan design operating point.

(B) Losses caused by "variable environmental properties" would be: lack of fan hub seals, excessive fan tip clearance, poor inlet conditions of the fan stack, excessively high approach velocity to the fan, or random air leaks in the fan plenum. Often allowance for losses in louvers, bug screens, etc. are simply omitted in design.

(C) Other performance losses could occur because of hot air recirculation.

Of the above losses, the only easily corrected problems would be in category which we call "variable environmental properties." In the following discussion category (A)will be covered in The Fan Itself. Category (B) will be discussed in The Fan Housing and (C) will be covered under Unwanted Air Movements respectively in below.

(1) The Fan Itself: The ways a fan system could be inefficient are sometimes obvious but most of the time they are not. For instance, the blade design itself is a major factor. Modern axial fans are usually made by molding fiberglass or extruding aluminum. Extruded aluminum blades are by nature always of uniform chord width while molded fiberglass blades can have an irregular shape. One of the basic design criteria for blade design is to produce uniform air flow over the entire plane of the fan. One of the aerodynamic principles involved is that the work done at any radius along the blade is a function of blade width, angle of attack and tangential velocity squared. The "angle of attack" in airfoil design dictates the amount of blade twist required at any particular radius along the blade.

It follows that as a point on the blade decreases from tip toward the hub the tangential velocity sharply decreases and in order to produce uniform airflow, the blade width and twist must be increased. If the blade chord cannot be increased in width, the twist must be increased to compensate. With an extruded blade the twist is created by mechanically yielding the blade to a prescribed degree. Due to limits in elasticity only limited twist can be created. In a molded blade there is no such limitation to chord width or twist so the ideal blade can be more closely approached.

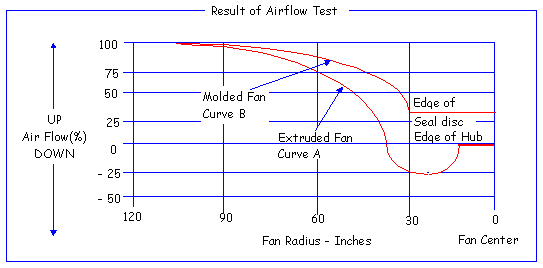
The point is, that the blade design itself can create problems of non-uniform air flow and inefficiency. Another inherent property of an axial fan is the problem of "swirl" which is the tangential deflection of the exit air direction caused by the effect of torque. The air vectors at the extreme inboard sections of the blade actually reverse direction and subtract from the net airflow. This is a very measurable quantity. Swirl can be prevented with an inexpensive hub component, which usually covers the inner 25 -30% of fan dia. The hub seal disc prevents this and should be standard equipment on any axial fan.

A real example that illustrates performance differences due to blade shape and seal disc usefulness is shown in above figure. This data was obtained by a major cooling tower manufacturer who carefully measured air flow magnitude and direction across a blade in a full scale cooling tower. Curve "A" shows the performance of an extruded aluminum straight type blade with no hub seal disc. Curve "B" shows performance of a tapered fiberglass blade with a seal disc. Both 20 feet diameter fans were tested under identical loading conditions of horsepower and speed. Note that significant negative air flow occurs at approximately the 40 percent chord point on the straight blade but no negative flow was found with the tapered blade.

Another component of the fan system efficiency would have to be the fan operating point where the system resistance line meets the fan performance line at the desired air flow defines a fan? operating point. At this point, the fan? output exactly meets the air-flow and pressure-drop requirements. Such a point will be represented by only one specific blade pitch angle, actual ft3/min and total pressure air output, and fan rpm.

This would be the particular blade pitch angle that produces the desired air flow against the required system resistance. This pressure capability and flow is a function of the fan tip speed. For a certain fan speed, only one pitch angle will satisfy the system design operating condition. This fan operating point will have a discrete efficiency. However, efficiency varies as much as 10 - 15 percent from pitch angle to pitch angle and even along the usable portion of each pitch. An usable portion of curve means beyond the "stall" conditions. This "stall" condition is easily discernible on the fan curve and is analogous to cavitation on a pump: it consumes a lot of energy but produces no work.

The most obvious thing to check pertaining to operating point is whether the fan is "stalled". If a poorly operating fan is suspected of stall, try lowering blade pitch and see if the static pressure (measured with a water manometer) in the plenum changes. If the pressure does not change, the fan may be stalled. A stalled fan draws more horsepower with increasing pitch, but air flow and static pressure may actually decrease.

 To be continued. Please press the next button.....


Because efficiency varies along pitch lines and with air flow, power can be saved and noise & vibration may be reduced by simply fine-tuning a fan? operating point. At various speeds, calculate operating points using speed factors, and check efficiencies at these points on the fan curve. Speed factor = curve speed / actual speed. If, for example, the curve tip speed was 12,000 ft/min, and the new speed is 10,000 ft/min, the speed factor = 12,000/10,000 = 1.2. (This can also be calculated in rpm. Tip speed = rpm x pie x fan diameter, or rpm = tip speed / pie x D.)

After calculating the speed factor, find the fan? new operating point: (ft3/min)2 = (ft3/min)1(speed factor), or (total pressure)2 = (total pressure)1(speed factor)2. Using the speed factor, the fan speed can be changed at will. Each new speed and pitch angle will improve or worsen the efficiency of original starting point. Plot total pressure vs. ft/min air flow for various pitch angles on the appropriate fan curve to obtain the horsepower requirements. Note that the pressure and flow work are the same at all the operating points, at which pitch angles differ.

The point here is that, within limits, the fan speed can be varied so that a pitch angle can be selected which will optimize fan blade efficiency and will satisfy the required system resistance. Often it would be desirable to slow the fan down to attain a higher, more efficient operating pitch angle as an operating point. This also has a side benefit of reducing noise and vibration because normally the lower pitch angles which appear obvious choice to handle the duty have lower efficiencies.

Still another aspect of system efficiency is the proper selection of the fan diameter for any given conditions, operating and economic. There are several things which influence the choice of fan diameter as below:

  • Air Flow Range
  • Fan Coverage
  • Optimum Cell Size
  • Evaluated Horsepower
  • Standard Sizes Available

Of these, the most logical influence is that the fan must provide the amount of air flow required for any duty in a sensible operating range. A quick look at any vendor's fan curve will yield several sizes of fans to do any particular job. A poorly sized fan will waste horsepower at the least and fail to do the required duty at the worst.

For wet cooling towers, the optimum cell size and evaluated horsepower comes into play. Both are purely economic considerations. Optimum cell size is obviously matching fan size to minimized construction cost per cell. The evaluated horsepower (E.H.) is increasingly becoming the major factor in deciding fan diameters. E.H. is a "dollars per horsepower" penalty added to a bid which is a measure of operating costs of that design over the capitalized life of that particular tower. Evaluated horse-power of $550/hp to as much as $2,500/hp are becoming common. The significance of E.H. is that very frequently the difference in evaluated horsepower of several fan selections can exceed the cost of the fan by many times.

In reviewing the potential losses in efficiency in the fan itself we have discussed two inherent losses that were built into the system by design.

  • Poor fan blade design
  • Poor selection of operating point

We also discussed the factor of optimized diameter which was decided economically before the air moving device was built. The two factors which could be physically modified to reduce fan system losses would be the addition of the hub seal disc and the revision of the fan operating point to a more efficient condition, although a change in the number of blades or gear reduction ratio might be required for the latter.

(2) The Fan Housing: The components that make up the fan housing would be considered a straight or velocity recovery stack for cooling towers. The most important system loss for both types would be the air leakage around the tips of fan blades. This loss is a direct function of the tip clearance with the stack and the velocity pressure at the operating point. This leakage is caused by the tendency of the high pressure exit air to recirculate around the tips into the low pressure air in the inlet. The loss takes the form of reducing the total efficiency and total pressure capability of the fan. There are several areas where inlet conditions can seriously affect the fan system.

  • Velocity Recovery Stack: Refer to Chapter 4 for more details.
  • Approach Velocity Consideration: Sometimes the economics of structural costs may unintentionally create very serious effects upon the system performance. As with inlet losses to the fan, the magnitude of the loss is a function of the velocity pressure which itself is a function of air velocity. It is considered good practice to insure that the air velocity at the entrance to the fan is no more than approximately one-half of the velocity through the fan throat.

(3) Unwanted Air Movements: There are often cases where in order to increase performance, you need to reduce air flow. These are cases where the warm exit air flow recirculates to the inlet side of the fan and decreases the mean temperature difference between the cold entering air and the hot water temperature in full thus lowering efficiency of the cooling tower.

The main factors which influence the tendency to recirculate are primarily inlet or approach velocity, exit velocity and velocity of prevailing winds. Gunter and Ships have formulated simple analytical methods to predict recirculation in a cooling tower utilizing the above parameters. The primarily causes of recirculation could be summarized as follows:

  • Excessively high approach velocities
  • Units placed in line with the prevailing wind direction
  • Units placed at elevations so that the exit of one is upstream of the inlet of the adjacent unit.
  • Low exit velocities, such as those encountered in forced draft tower.

Severe performance problems can result if recirculation is encountered. Recirculation can be confirmed by smoke testing and by temperature surveys of the exit and inlet air streams to a unit. To eliminate recirculation it is usually necessary to increase the exit airflow or changes the elevation of the exit flow by adding straight sided fan stacks. In some cases baffles may have to be considered.

In cooling towers the effect of the velocity recovery stack is to reduce the exit air velocity which could promote recirculation. It may be necessary to utilize straight stacks to jet the hot exit air further away from the approach or inlet areas.

Air leakage is another category of unwanted air flow. Air leakage could occur in a cooling tower at several places which lower the system efficiency.

  • Missing access door panel in the fan stack
  • Holes (pass way of coupling shaft) in the fan stacks
  • Missing boards or holes in the fan deck

The net result of these problems is that the air movement intended to go through the fill takes the path of least resistance and consumes power but does not work.

3)Fan Tests

Since the fan test reports are not available, the result of fan test applied to the air cooled heat exchanger was quoted from a technical paper published by Hudson. There will be no much difference in the results with the application of cooling tower.

To illustrate the negative effects on fan systems efficiency we have discussed, a series of full scale fan tests were performed. The basic scheme was to test a forced draft air cooler at three different air flow rates in four conditions each:

  • Standard (with inlet bell, seal disc, and close tip clearance)
  • Remove inlet bells only. Test unit and replaces inlet bells.
  • Remove seal disc only. Test unit and replace seal disc.
  • Increase blade tip clearance.

A total of twelve tests were performed and a 20 feet x 32 feet, four row forced draft air cooler with two 14 feet diameter fans was tested. Modifications were made to the same single fan only. The fan operated at 10,000 FPM tip speed and was equipped with a 30 hp Reliance 1,160 rpm motor. The finned section was a typical 1" O.D. - 10 fins per inch extruded finned tube bundle. The unit was equipped with both steam coils and louvers which were locked in an open position during the test period. The testing equipment used included the following:

  • Taylor Model 3132 Anemometer
  • Draft Gauge
  • Tachometer
  • Westinghouse Model PG-101 Power Analyzer

(1) Procedure: For each test, air flow (CFM), static pressure, temperature, and electrical power consumed was measured. Electrical measurements included volts, amperes, watts, and power factor. Electrical power input was calculated by the relation:

                    V x A x Power Factor x 31/2
HPoutput =----------------------------------------------
                                    746

(Power factor: A measurement of the time phase difference between the voltage and current in an A-C circuit. It is represented by the cosine of the angle of this phase difference. For an angle of 0 degrees, the power factor is 100% and the volt/amperes of the circuit are equal to the watts. (This is the ideal and an unrealistic situation.) Power factor is the ratio of Real Power-KW to total KVA or the ratio of actual power (watts) to apparent power (volt-amperes). Real Power-KW is the energy consumed by the load. Real Power-KW is measured by a watthour meter and is billed at a given rate ($/KW-HR). It is the Real Power component that performs the useful work and which is affected by motor efficiency.)

Velocity Pressure was calculated by:

                            CFM
P = [--------------------------------------------- ]2 Inch Aq.
        Net Free Area of Fan x 4005

System Efficiency was calculated by:

      Total Pressure Actual x CFM
E = ---------------------------------------------
               6356 x HPinput

Thus, the effect of only one variable was investigated for each of three flows which were at 0.061, 0.100 and 0.130 inches velocity pressure.

(2) Discussion of Results: Below table shows a comparison between curve fan efficiency and the tested system efficiency. Test 1 and 2 showed a 10 - 15 percent decrease from curve efficiency as might be expected. Test 3 showed a 30 percent decrease from curve efficiency which was surprising. Full scale testing at best cannot achieve accuracy or repeatability better than about plus or minus 5 percent. The effects of ambient winds during the test period are by far the biggest cause of error. Variations in velocity and direction during the test period cause most problems while objects around or on the test unit create eddy currents of wind with corresponding high and low pressure areas. The total system efficiency was considered "base" performance for the tests that followed.

Test

Fan Pitch

Curve Fan Efficiency

Test System Efficiency

Test 1

14o Pitch

80.3%

70.7%

Test 2

8o Pitch

85.4%

71.2%

Test 3

3o Pitch

86.0%

58.6%

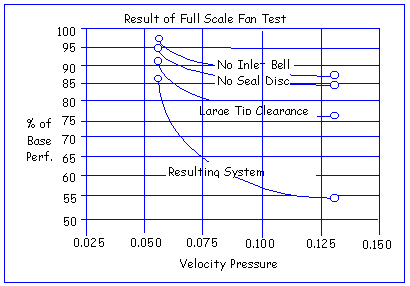
Considering the base performance in each case was 100 percent, let us examine the effect of each variable in turn. Below result of full scale fan test curve shows the negative effect of only one variable for each test point with the resulting decrease in base system efficiency.

In reviewing the results shown, it can easily be seen that the negative effects that rob system efficiency are a function of the velocity pressure. While not demonstrated on this test, previous tests have shown also that the effects of the three parameters studied are indeed cumulative. That is, the total decrease in performance will be the sum of each individual effect. Thus, we can see that the negative effects within the scope of this study would decrease the base performance of this test fan by magnitudes of 15 to an astonishing 58 percent. Keeping in mind the previous decrease in "base" system performance from the idealized "curve" system performance, this should point out the importance of considering the real system efficiency.